
Originally published: October 28, 2013
Gold is still going to $700, and it's not a question of IF, but WHEN it is going to crash again.
Why? Gold was in a bubble from 1999 until September 2011, rising from $250 an ounce to over $1900. The fundamental reasons all supported gold's rise, and the terrible economic situation and steep stock market drops led many investors and individuals to look to gold as the only "safe" and "reliable" solution. But just because gold is a tangible and historically-valuable asset doesn't mean that gold's soaring prices were justified. Yes, gold will always be worth something and will always have value, but who says that it should be $2000 and not $500? In reality, and as a rule of investing, when so many people crowd into one stock or investment, and prices rise to extreme levels, it is usually worth avoiding. Many times, as we've learned all too well in the case of technology stocks (Dot-Com Bubble) and housing (Housing Bubble), the reasons to buy make sense - but actually doing so may be foolish.
Gold has already proven to be extremely ineffective as a "safe haven."
Aside from all of the characteristics of a bubble which gold displayed leading up to the September 2011 peak (read my book), the huge volatility and severe drops we have seen in gold prices since then should be enough warning to investors. Down nearly 40% from over $1900 to $1200, such a massive price decline is proof in and of itself that gold is by no means a "safe" investment. Nothing that drops that much is safe, and the reliance on gold as "safe" by so many investors was actually one of the biggest reasons that gold was in a bubble.
$2000 gold will not be reached for years to come, if ever.
We have already seen the best days for gold; could the enthusiasm and extremely optimistic investor behavior we saw in 2010 and 2011 really be matched again? Now that prices have dropped so dramatically, hasn't gold proven itself a poor investment choice? Yes, you can buy gold on the dips and make some money as it bounces; but if we've seen the best already, why even buy gold if it most likely won't break above $2000? If anything, look for better opportunities elsewhere.
HOW I PREDICTED THE BUBBLE, and why it may get much worse.
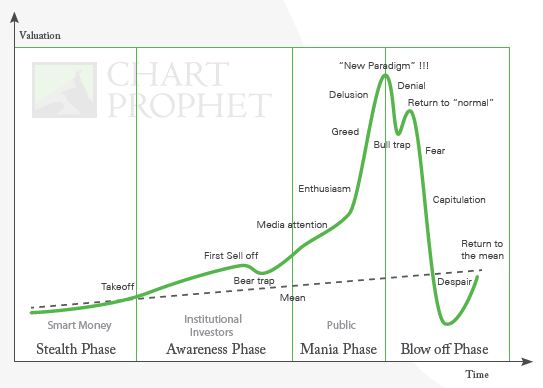
The charts below represent the best visual example of why gold has much downside left. Comparing gold's run since the early 1970s, and especially the parabolic rise since 1999, to the general anatomy of a bubble, we can clearly see a number of similarities. Most importantly, the unfinished gold chart still has to play out; and according to the way a typical bubble collapses, gold has not even entered the sharpest phase of decline yet. For now, gold is just a "bull trap" - tricking many investors and gold bugs that gold is stabilizing for the long term, and that the worst is behind us. I think they're very wrong.
See the MAJOR similarities?
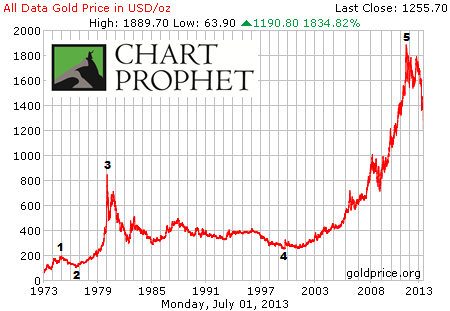

Chart and phases based on Jean-Paul Rodrigue
WHY GOLD BOUNCED AT $1200.
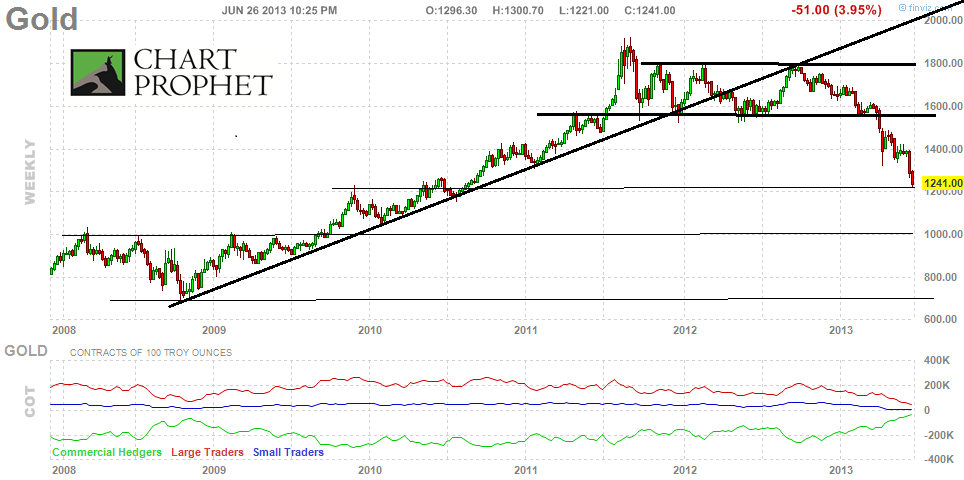
After a long period of uncertainty about gold prices between September 2011 and April 2013, the market finally made a decision as gold crashed from $1600 to $1200 in just over two months. Gold prices had been stuck in a sideways trend, as they bounced between $1500 and $1800. Then, in October 2012, gold failed for the third time at $1800; I knew it was going down from there (SEE: Gold Fails 3 Times & FOX Business Gold to $700).
The sharp drop from $1800 to $1200, with a very strong breakdown through critical support levels ($1500-1550), signals the future direction for gold: DOWN.
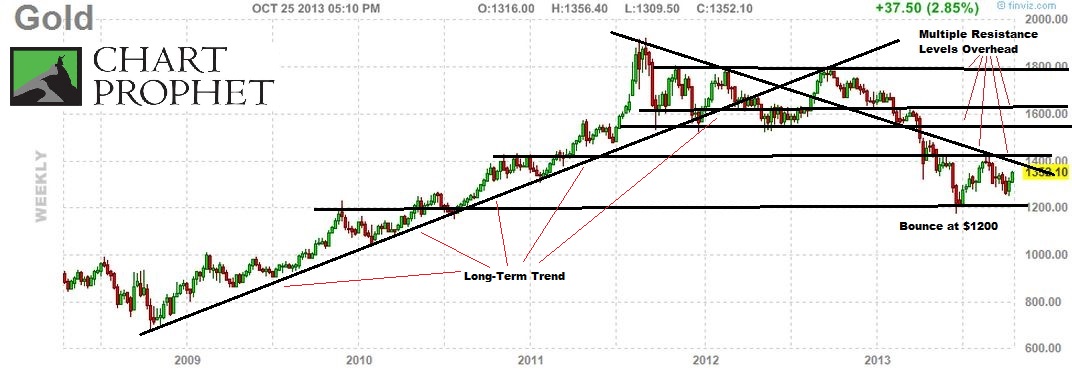
But gold is not going to just collapse to $700 overnight. It takes time, with ups and downs along the way. Therefore, I predicted in 2011 that gold's collapse would pause at $1200 and $1000. Judging by previous key levels in late-2009 and mid-2010, I noticed $1200 as a high-potential support zone.
In late June 2013, the timing for my prediction couldn't be any more perfect. Using the chart below, I predicted that gold would likely bounce at the $1200 support nearby.
In my TV appearances (CNBC, Yahoo Finance, BNN) at the end of June, I predicted the EXACT bottom in gold prices. I was expecting strong support at $1200, and prices bottomed on the exact day I was on TV. (Click on images to watch)

Look at what happened on June 27th as I appeared on CNBC:
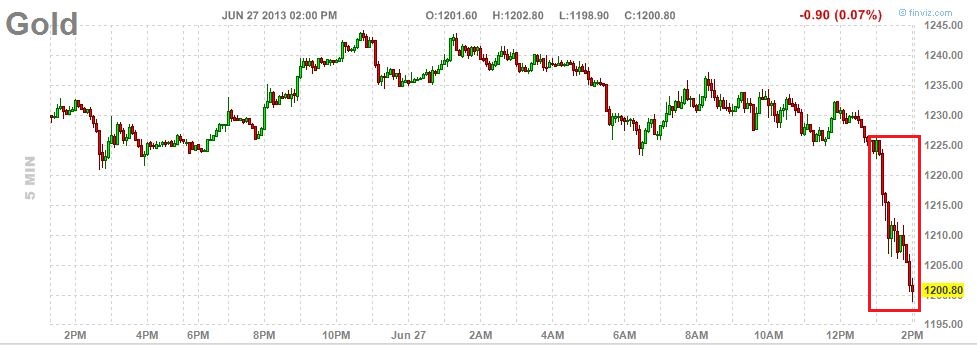
As CNBC had me on at 1-1:30pm, gold prices plummeted from $1225 to $1200 in less than an hour. Even better, I predicted that day that gold would bounce for "weeks or months" - and that exactly happened as gold bounced from $1200 that day to over $1400 by the end of August. Call it good research, excellent timing, and definitely some luck.
Since June 27th, gold has been in a "bounce." Notice how perfectly gold bounced off $1200:

Why did gold bounce?
1) The drop in gold was too fast and too sharp to continue without a pause.
Firstly, after a very devastating drop from $1800 to $1200, gold was due for a temporary recovery or "breather." Gold is not just going to crash to $700 without a few pauses, called "counter-trend movements." This bounce is just one of those moves.
2) Cost of mining/production is around $1200 (for now).
Secondly, $1200 is considered to be the cost of mining gold at this time. Though costs were only around $600 a few years ago, they have risen dramatically. And since the break-even cost of mining gold is $1200, gold bounced at that level because (for now) it would be unprofitable for mining companies if gold fell below the actual cost. However, as profitability in the gold mining sector continues to decline, competition will be greatly diminished - which will then lead to lower costs of mining. As costs decrease, the price of gold will also be able to fall further. On the other hand, gold could also just crash below $1200 before actual costs do.
3) China and emerging markets are bouncing or recovering here, so demand is more stable.
Thirdly, gold's bounce was signaled by the bounce in China (NYSEARCA:FXI) and emerging markets (NYSEARCA:EEM) as well as the bottoming in the US stock market in late June 2013. Since a large part of gold's rise in the past few years was fueled by Asian demand and emerging market growth, the recovery in those economies and stock markets helped gold find support. So long as China can continue to recover, gold could benefit. However, the recovery in both China and gold are likely not sustainable. (See: Large Gains Ahead In Cyclical Commodity Stocks, Depending On China Bounce)
4) QE still not over.
Though Quantitative Easing (QE) will eventually be terminated, its continuation further supports gold for the time being. We have already seen tremendous backlash against money-printing and government intervention, not to mention the enormous debt that continues to grow. That said, the winds of change are blowing, and gold's days are limited. Once QE ends or gold investors realize that monetary policy no longer helps support gold prices, a sharp drop is definitely possible.
WHY GOLD WILL FAIL AGAIN.
Gold's rise since $1200 is just a "bounce" and not a full "recovery." If that is true, it means that gold will not see new highs above $2000 for years, if ever! We expect gold's bounce to end in the $1500-1700 range before starting the next leg down, or even crash. $1800 is possible, but unlikely; and $2000 is almost certainly impossible. Even if you believe gold will continue rising, you're much better off investing in other commodities (steel, aluminum, platinum, natural gas) and select stocks - which will outperform. Investors should avoid gold for a number of reasons.
1) The best is already behind us.
With the parabolic price rise, extreme expectations, over-speculation, and massive media exposure, can we really say gold has even better days ahead than what it already saw leading up to the September 2011 peak? The days of fanatical investor euphoria and excessive reliance on gold are behind us. We've already seen all of the characteristics of a bubble (SEE: Chapter 3, "Signs of a Bubble," Gold Bubble). Nearly everyone who will invest in gold has already done so. Some gold investors got out in time, some learned the hard way, and the rest are just hoping that new all-time highs are ahead.
2) Reality setting in; gold not a safe haven!
Gold has proven itself NOT a safe haven. One of the main reasons for gold's rise was its public image as a "safe" investment, especially in times of recession and stock market volatility all-too-common since 2001. But gold's nearly 40 percent drop since 2011 has proven that gold is by no means "safe." Many investors are finally realizing that their over-reliance on gold has been misled and financially dangerous.
Gold has failed to perform even in times of turmoil, precisely when it was expected to rise (during the stock market declines of 2012, European economic crisis, Greece & Cyprus banking crises, emerging market slowdowns, Middle East upheavals, political brinksmanship, etc.). Gold is ineffective as a safe haven. Slowly but surely investors are starting to accept the fact that gold has been an "illusion of safety in an uncertain world." As more gold bugs snap out of their delusion, selling will certainly accelerate.
3) Gold in lose-lose situation.
Gold will fall regardless of the economic situation. On one hand, if the stock market continues higher and the economy improves, gold will fall because there will be less need for the "safe haven" and many investors will sell their gold in order to chase performance by buying stocks and other asset classes. On the other hand, if the stock market falls and the economy deteriorates, gold will fall due to the shrinking liquidity, falling commodity prices, and increasing correlations during deflationary periods (just look at gold's 30%+ decline during the deflationary recession of 2008).
In other words, gold prices will drop in either scenario: If you believe in the global economic recovery, you don't need gold; and if you believe in a renewed global recession, gold won't save you! Jeff Macke is right when he says gold is "a hedge against capital gains."
4) Debt ceiling & end to "easy money."
Gold's rise has been very strongly correlated to the rising debt limit and increase in money supply. The recent raising of the debt ceiling in October 2013 and prolonging of the debt debate helps gold for now. 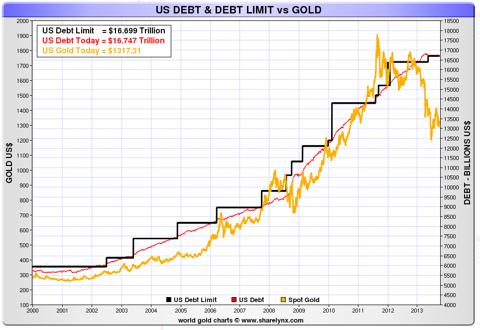

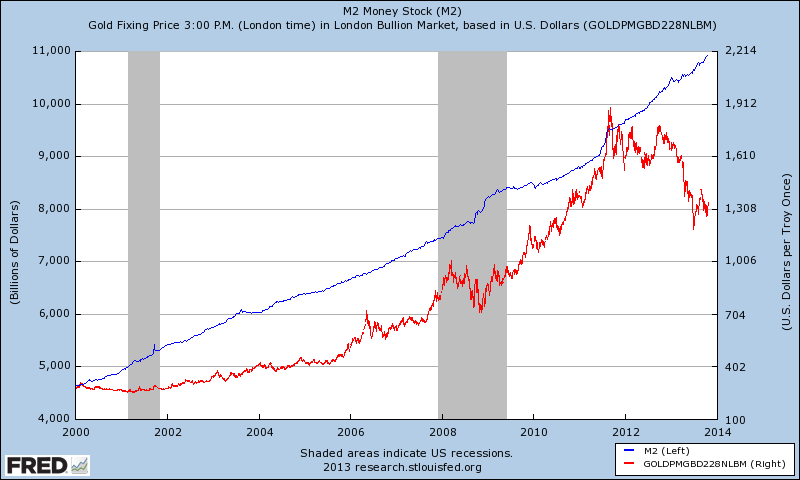
Gold's enormous rise was driven by the unprecedented increase in "easy money" - seen clearly by the comparison of the soaring M2 money supply and gold prices: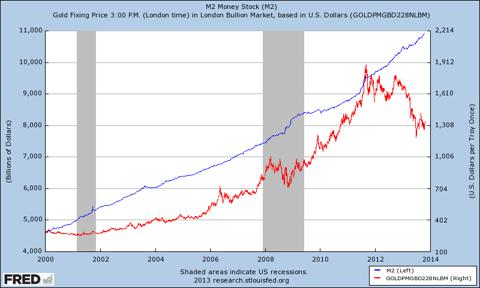
However, the trend has been broken over the past year (as gold fell sharply regardless of the high debt ceiling and increasing money supply), and the unsustainable debt levels are very close to a peak.
We're already seeing major changes underway in response to the dangerous and fiscally irresponsible actions taken by governments and central banks around the world. While their actions to stimulate the economy could end up saving the global financial system and supporting the recovery, time is running out. Most people don't realize that reaching the debt ceiling, increasing taxes, sequesters, and government shutdown are actually NOT good for gold because they all point to:
Less spending, less money printing, less QE = Less money in the system = Deflationary pressures = Stronger US Dollar = Lower gold prices.
Pressure for more responsible policy and behavior has radically increased over the past two years. Many politicians and economists, especially conservatives, have grown extremely dissatisfied with the growing risks of easy money and rapidly growing debt. We've already seen fighting over additional QE, the debt ceiling, and taxes - and the debate is not over.
Over the next year, political backlash and financial responsibility will likely result in a refusal of taking on additional debt or continuing QE. There is simply a limit to how high debt levels can soar; eventually they must be controlled - and that is a bad outcome for gold.
5) Long-term trend is broken.
I warned on a number of occasions that gold's long-term bull market was over. Aside from the facts that gold was in a bubble and that the fundamental reasons no longer justified gold's price, I pointed to severe warnings based on breakdowns in gold's price action and charts - known as technicals (SEE:Gold's Technical Picture Is Broken; Collapse Coming & Gold Fails 3 Times). Technical analysis is my expertise (hence "Chart" Prophet), so I am always on the lookout for where prices are headed next. Using technical analysis, I can spot trends, predict critical price levels, observe supply/demand factors, mitigate any risk, improve entry/exit for my trades, and understand what investors are thinking with nothing but charts (of course, I support my arguments with much more than just the technicals).
With gold breaking below the long-term trend, which started in late 2008, and then sharply falling through the critical support level of $1500-1550, the downtrend was confirmed. It was no longer a question whether or not gold prices were going to fall; a collapse was imminent.
Even worse, gold has failed in multiple ways, which almost guarantees that it still has much more room to fall. First, the parabolic rise from $250 in 1999 to over $1900 in 2011 was completely unsustainable. Second, the long-term trend from late 2008 to early 2012 was broken (see above). Third, the critical $1500-1550 support level was sharply broken in April 2013 leading to a very sharp drop to $1200. Fourth, gold violated key moving averages, which supported it on the way up, and even saw the infamous "Death Cross."
I pointed out the serious moving average violation in June 2012:
Gold has also broken below very significant moving averages - the 150, 200, and 300 Day Moving Averages. Usually, so long as price is above the moving averages, the momentum is positive and the trend is intact. But with a drop below the moving averages, prices have lost their support and now have room to fall as the trend is broken. Even worse, the moving averages above - which once served as support - are now acting as strong overhead resistance. With the 50-day MA crossing below the 200-day MA and the 150-day MA crossing below the 200-day MA, we now also have a confirmed "Death Cross" in moving averages, which bodes very poorly for gold.
The first "Death Cross" and the first break below the 300-day moving average were a warning. Gold prices recovered temporarily from June 2012 until October 2012, when they failed again at $1800. Only in February 2013 did the second "Death Cross" and fall below the 300-day moving average take place; but that was definitely a sign of extreme danger, as gold prices have never looked back since.
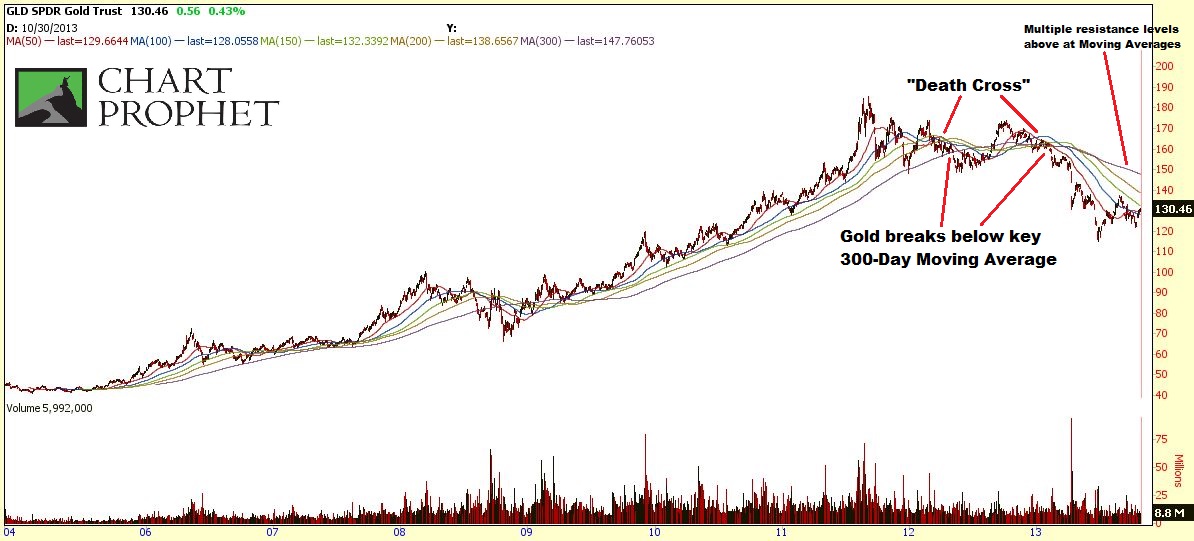
6) Major overhead resistance.
Perhaps the most concerning aspect for gold going forward is the massive resistance now overhead. One of the main rules of technical analysis is that "Previous resistance becomes support" and "Previous support becomes resistance." What that means, is that when the price breaks above a resistance level, that level becomes support; and when the price drops below a support level, that level now becomes an area of resistance.
In the case of gold, the sharp drops below multiple supports signaled that those previous strong support levels are now strong resistance levels, which act as a barrier against rising prices. Hence, now we understand why gold's bounce from $1200 paused at around $1400 in late August 2013 ($1400 was resistance in late 2010, support in early 2011, support again in April and May 2013, and then became resistance in June 2013 when prices fell below it). Furthermore, there are still MAJOR resistance levels above at the previous levels and key moving averages, which acted as support before gold fell to $1200 (see previous two charts).
Gold could definitely continue its bounce, and will likely break above a few of these resistance levels. However, there are so many potential resistance zones/levels between $1400 and $2000 that it is almost a certainty that gold will fail again and continue its decline to $700.
7) Momentum to the downside, backed by heavy selling.
Though short-term momentum for gold is to the upside, it is absolutely clear that long-term momentum is to the downside. Aside from all the points above which signal a continued struggle for gold, things could still get much worse. For example, investors have still not fully accepted that gold isn't a safe haven; monetary and fiscal policy still haven't become restrictive, which would limit gold's firepower; and we haven't seen real capitulation by gold investors yet. There was enormous selling pressure as gold dropped, but we haven't even seen the real panic yet. Gold is bouncing, but don't get too used to it.
8) Bubbles fall much further, due to panic.
Gold has a lot more room to fall because the bubble is yet to fully deflate. Even if its intrinsic value is higher, gold is likely to fall below its long-term average because that is the nature of asset bubbles as they collapse:
The existence of a speculative bubble in gold makes the upcoming price collapse much more dangerous. Since the implosion of a bubble tends to drag prices down even below long-term averages, as panicked investors overreact to the downside, we can forecast prices to drop to levels near gold's long-term mean ($500 to $700) and below…The most important thing to remember is: once the bubble pops, the trend is down.Source: Gold Bubble, page 79.
My long-term target for gold is $700. I expected the bounce at $1200, but consider it just a "sucker's rally":
I think we have absolutely confirmed an all-time peak in gold which will likely never be reached again. Therefore, though gold may find support at $1200 or $1000 (a big psychological number), it will ultimately fail again and fall to $700 or below. The bounce off of support could be sharp and could last months or even longer, but it will just be a sucker's rally to invigorate the gold bulls to load up again right before the next devastating drop.
We haven't even seen the bubble fully play out. We are either approaching the "Return to 'normal'" phase or in the midst of the "Fear" phase, but definitely not yet in "Capitulation" or "Despair."
CONCLUSION
The ultimate direction of gold prices is towards the beginning of where the bubble began at $250 in 1999. Our target is $700, but it won't happen overnight; we will undoubtedly see gold find strong support a few times on the way down. Either way, however, you're fighting a losing trend. Now that the bubble has officially popped, gold is a broken trade. Why buy gold when it is clear that the best is behind us and when many negative catalysts are yet to play out? Gold prices will almost certainly bounce, but why chase a losing investment theme when you can, instead, look for new and better opportunities?
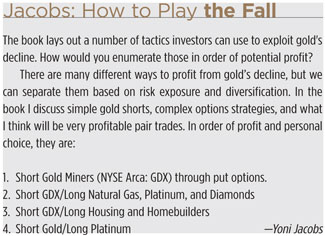
In June 2012, I recommended that investors play the gold bubble as follows:
A year later, Brad Zigler followed up with the results of those gold shorting strategies:
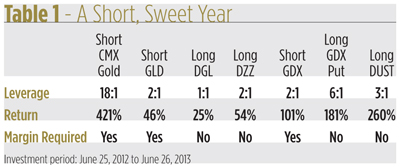
Source: Rep Magazine - Tarnished Gold
It turned out that every single one of my recommendations was enormously profitable for those who paid attention. Not only did gold (NYSEARCA:GLD) and gold miners (NYSEARCA:GDX) plummet, but the pair trades I recommended - buying natural gas (NYSEARCA:UNG), platinum (NYSEARCA:PPLT), diamonds (NYSE:ZLC), and housing (NYSEARCA:XHB) - all greatly outperformed.
What should you do now?
First and foremost, forget about gold as an investment. Second, look elsewhere for much better investment opportunities (SEE: Large Gains Ahead In Cyclical Commodity Stocks, Depending On China Bounce). Finally, let the gold bounce play out and prepare to short it right before it crashes again.
No comments:
Post a Comment